True Colour vs. False Colour in the Polar North
Multispectral instruments such as the Operational Land Imager (OLI) aboard NASA/USGS Landsat 8 and 9, or the Multispectral Instrument (MSI) aboard the European Space Agency’s Sentinel-2 satellites, record reflected sunlight across discrete wavelength bands—from visible light into the near-infrared (NIR) and shortwave infrared (SWIR).
A True-Colour Composite assigns red, green, and shorter visible light bands to their corresponding display channels, producing an image that matches what an astronaut looking out a spacecraft window would observe. However, in the Arctic, true colour has limitations: low sun angles cast deep mountain shadows, and white snowfields blend seamlessly into white stratus cloud decks.
To solve this, analysts generate False-Colour Composites. When Near-Infrared (around 865 nm) is assigned to the red display channel, healthy tundra vegetation—whose spongy mesophyll leaf cells reflect near-infrared energy intensely—glows vivid crimson or terracotta. When Shortwave Infrared (1610 nm and 2200 nm) bands are used, snow and ice stand out starkly from liquid water clouds and exposed rock.
| Sensor & Band Mode | Spatial Resolution | How Arctic Features Appear |
|---|---|---|
| Sentinel-2 True Colour (Bands 4-3-2) | 10 metres | Snow is white; tundra is olive-brown; sediment plumes are tan; deep water is dark slate. |
| Landsat 8/9 Near-IR False Colour (Bands 5-4-3) | 30 metres | Active tundra vegetation appears bright red/terracotta; clear water is black; silty water is pale tan. |
| Shortwave-IR Composite (SWIR-NIR-Red) | 20 – 30 metres | Differentiates snow/ice from clouds; highlights bare bedrock lithology in warm ochre and olive tones. |
| Sentinel-1 C-Band SAR (Radar) | 5 – 20 metres | Greyscale backscatter; sees through polar night and clouds; rough multi-year sea ice is bright, calm water is black. |
Reading Arctic River Deltas from Orbit
Great northward-flowing rivers—the Mackenzie in Canada, and the Lena, Ob, and Yenisei in Siberia—collect snowmelt from vast sub-Arctic watersheds and deliver it across frozen coastal deltas in late May and June.
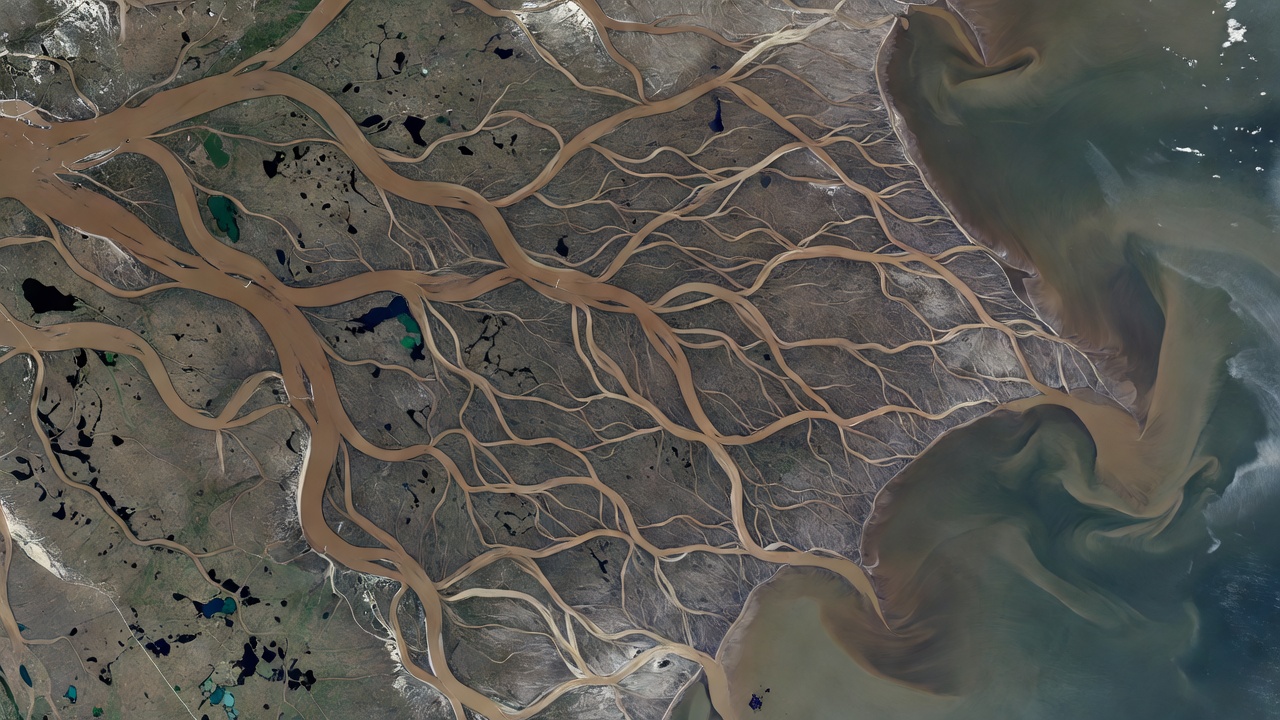
Braided Channels & Thermokarst Lakes
In orbital views of the Lena Delta (covering roughly 32,000 square kilometres), thousands of anastomosing channels weave around polygonal peat islands peppered with oval thermokarst lakes. Each lake’s colour—ranging from black (deep, clear, humic-stained) to tan (shallow, wind-stirred silt)—reveals its depth and connection to active river flooding.
Image context: NASA Earth Observatory / USGS Landsat public domain archive.
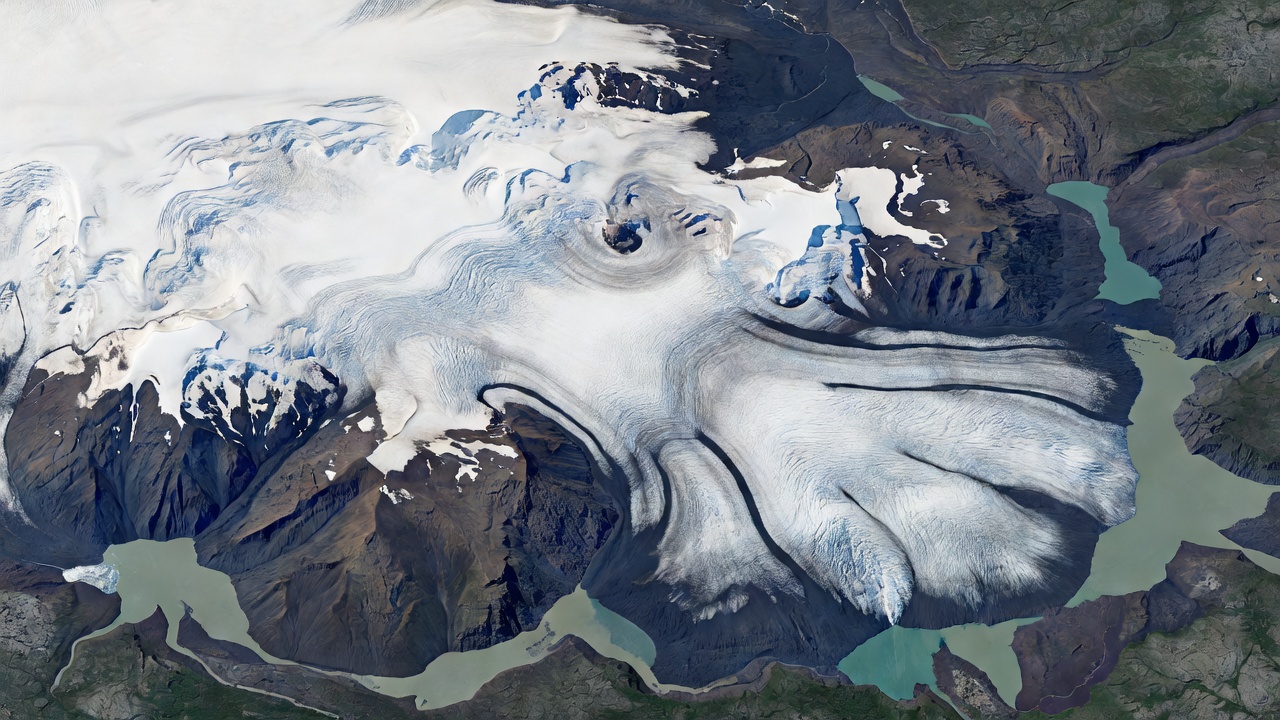
Piedmont Glacier Lobes & Proglacial Lakes
Seen from 705 kilometres overhead, the southern outlet lobes of Vatnajökull spread across dark basaltic outwash plains (sandur). Dark tephra bands curve in parabolic arcs that show ice velocity: the centre of the glacier flows faster than the friction-slowed valley walls.
Image context: ESA Copernicus Sentinel-2 modified observation data.
Seeing Through Darkness with Synthetic Aperture Radar
Optical satellites rely on sunlight, meaning they cannot image high Arctic latitudes during the winter polar night or through persistent summer marine fog. To monitor glacier speed and sea ice drift year-round, scientists use Synthetic Aperture Radar (SAR) instruments such as ESA’s Sentinel-1 and Canada’s RADARSAT Constellation Mission.
SAR satellites transmit their own microwave pulses toward Earth and measure the roughness and dielectric properties of the surface from the returning echo. Smooth open water reflects radar pulses away from the satellite like a mirror, appearing pitch black. Rough, deformed pressure ridges in multi-year sea ice or heavily crevassed glacier margins scatter radar energy back toward the sensor, appearing bright white and silver.
How Satellite Time Series Build Environmental Evidence
One Cloud-Free Summer Pass
A single Sentinel-2 image captures open water leads in the Chukchi Sea or melt ponds atop the northern Greenland Ice Sheet on a specific July afternoon.
Radiometric Calibration
Analysts correct for atmospheric aerosols, sun angle, and sensor drift so surface reflectance values from different years and different satellites can be compared mathematically.
45+ Year Continuous Record
Continuous passive microwave satellite observations since October 1978 (NSIDC Sea Ice Index) provide an unbroken, cross-calibrated daily record showing a downward trend in September Arctic sea ice extent.